IQubz provides BI consulting and develops custom solutions in business intelligence, data analytics, data visualization and data integration. With easy-to-navigate dashboards, comprehensive reports, charts and scorecards, IQubz BI helps you:
-
Get a 360-degree view of your finance, operations, sales and marketing functional areas
-
Understand your customers, market trends, operations, sales and purchasing better by identifying hidden trends, opportunities, and anomalies
-
Make informed decisions confidently, based on the accurate insights
-
Make adjustments early to tap into future opportunities. Increase your revenue, reduce costs, and gain competitive advantage
Agriculture
Construction
eCommerce
Finance
Healthcare
Hospitality
Insurance
Manufacturing
Mining
Real Estate
Retail & Wholesale Trade
Software
Travel
Utilities
Insights. Productivity. Profit.
BI Consulting
Enterprise Reporting & Data Analytics
- Performance Management: Consolidated, multi-company reporting for side-by-side comparisons of regions, companies, divisions and branches
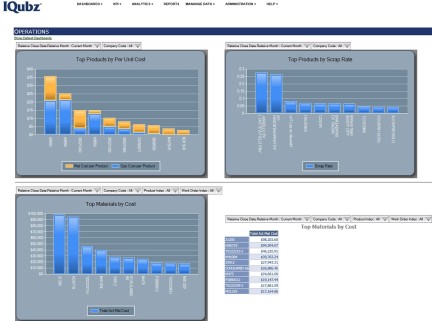
- Operations Management: In-depth operations analysis for material, labor, overheads and business processes
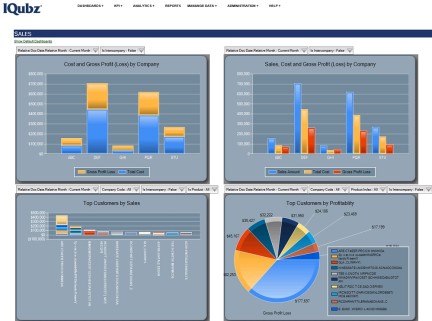
- Sales Management: 360-degree view of customers and products with sales, costs, gross margins, delivery schedules, open sales orders and backlogs
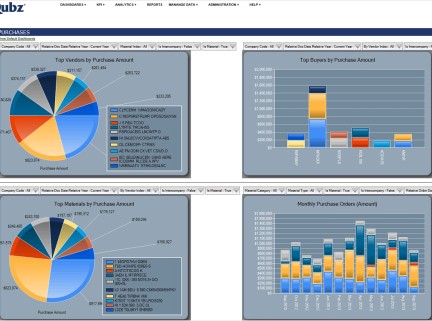
- Supply Chain Management: 360-degree view of vendors and material with costs, purchase price variances, receipt schedules, open purchase orders and overdue POs
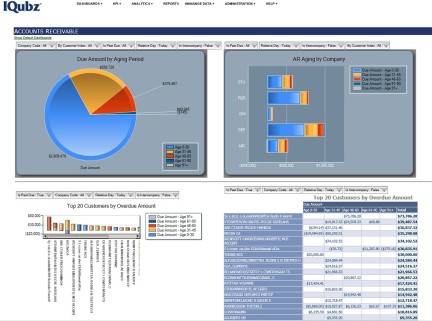
- Financial Management: Trial Balance, Income Statement, Balance Sheet, Accounts Receivable statement and Accounts Payable statement with aging history
- Dashboard and Scorecards: Interactive KPI dashboards and scorecards with Power BI
- Ad-hoc Reporting: Powerful ad-hoc reporting and self-service BI with Power BI and Excel
In-depth Insights
- Customer Profitability
- Product Profitability
- Top Customers
- Top Products / Services
- Supply Chain Analysis
- Vendor Price Variance
- Labor Productivity
- Material Cost Variance
- Accounts Receivable Aging
- Accounts Payable Aging
- Top Debtors and Creditors
Contact IQubz
Multi-Company Consolidated Analytics
Sales, Sales Backlog, Gross Margin
- Customer 360 report
- Customer Price / PO Expiration report
- Gross Margin / Gross Profit / Profitability report
- Open Sales Order Monthly / Weekly Due report
- Product 360 report
- Sales Backlog History report
- Sales Flash report
- Daily Shipping report
- Daily Billing report
- Shipped Not Billed report
- Sales Order Backlog report
- Top N Customers
- Top N Products / Services
Supply Chain
- Daily / Fiscal Year Vendor Summary report
- Material 360 report
- Material Requisition Planning (MRP) report
- Open PO Vendor reports
- Open PO Weekly Payable / Pending report
- PO Receipts by Vendor reports
- Purchase Price Variance by Part / Vendor reports
- Vendor 360 report
- Top N Vendors
- Top N Materials
Operations
- Freight Spend & Recovery report
- Labor Tickets Scrap report
- Work Order Cost reports
- Work Order Cost Variance report
Financial
- Financial Highlights
- Financial Trending
- Consolidated Trial Balance
- Balance Sheet
- Income Statement
Accounts Receivable
- Collections
- Receivable by Week / Month Due
- Receivable by Aging / Overdue
- Open Invoices Statement
- Recently Created Invoices
- Top N Receivables
Accounts Payable
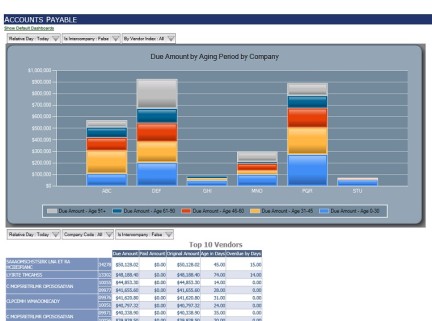
- Payable by Week / Month Due
- Disbursements
- Payable by Aging / Overdue
- Recently Entered Vendor Invoices
- Top N Payables
BI Consulting Summary
- Multi-Company Data Consolidation with Multi-Currency Support
- In-depth Coverage of the Key Functional Areas: Sales, Purchasing, Finance, Operations and Inventory
- Enterprise-wide Performance Management via Secure Web Portal
- Self-service, Personalized, Interactive Dashboards with Key Performance Indicators (KPI)
- Drag-and-drop Ad-hoc Reporting, Charting and Analysis with Microsoft Excel and Power BI
- Key Reports including Customer 360, Vendor 360, Work Order 360, Sales Flash, Balance Sheet and Profit & Loss Statements
- On-Premise or Hosted – choose what fits your business best
- Extensible – add new report models and cubes for additional subject areas; create and publish new reports and KPI dashboards with Power BI
- Scalable – add more companies and users as your organization grows.



 IQubz LLC
Foothill Ranch
Lake Forest (Orange County)
California, USA
+1 (949) 273-8876